

The March Madness Effect to Local Businesses—Beyond the Bracket
Cuebiq’s foot traffic data from 13 host cities reveals how the tournament’s real economic pulse to local businesses—and what it means for brands who want to engage with where fans eat, drink, and spend.
The brackets have long busted. The buzzer-beaters and Cinderella upsets are all in the rearview mirror. But looking back at insights on the effects a March Madness game has on host cities is valuable to inform future marketing and promotions.
During the tournament, entire local economies shift to accommodate tens of thousands of out-of-town visitors. And the restaurants, bars, and entertainment venues near the arenas feel it in ways that don’t always make play-of-the-day highlights.
Welcome to Part 2 of our Sports Tourism series, where Cuebiq’s privacy-safe location intelligence measures how major sporting events reshape real-world foot traffic. In Part 1, we mapped the geography of Spring Training fandom and showed how baseball fans travel more than 1,000 miles to catch their teams in the Grapefruit and Cactus Leagues. Now we’re turning to a bigger, faster, more chaotic event: March Madness.
The Tournament’s Scale—On Screen and on the Ground
The 2026 NCAA Tournament was the most-watched in history. The first two rounds averaged 10.1 million viewers—an all-time record—with each round individually setting its own mark. The National Championship Game between Michigan and UConn drew 18.3 million viewers, the most-watched title game since 2019, peaking at 20.4 million viewers late in the evening. The 2026 Men’s Final Four averaged 14.2 million viewers, up 11% from the year prior. ANd March Madness social accounts generated 1.4 billion content views, up 189% YoY.
And while LTV viewership, streaming numbers, and social engagement are important, they don’t show the IRL impact the tournament can have for local POIs dependent on foot traffic for their business.
For the cities that actually hosted games, this story plays out on the ground—at QSR counters, casual dining booths, and entertainment venues within reach of the arenas. Cuebiq measured anonymized, privacy-safe opted-in device data across 13 host cities throughout the tournament window, comparing foot traffic in Casual Dining, Quick Service Restaurant (QSR), and Entertainment POIs against pre-tournament baseline averages. What we found reveals that the tournament’s economic impact is real, material, and—critically—uneven depending on the city.
The Standout Cities: Where the Tournament Moved the Needle Most
Not every host city sees the same lift, and that gap matters for brands, sponsors, and hospitality operators trying to understand where to concentrate their efforts.
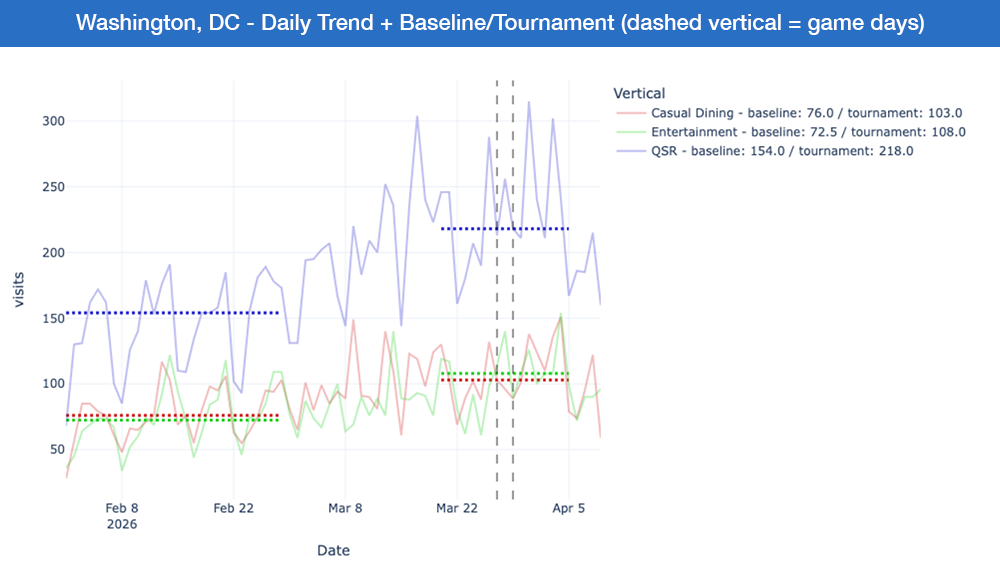
Washington, D.C., led all host cities across every vertical. Casual dining foot traffic jumped over 35% above baseline during tournament days. Entertainment venues surged 33%. QSR visits rose 30%. Washington hosted Elite Eight games, and if foot traffic is assumed as a proxy for spend, the data reflects the spending intensity heightens with late-round tournament action when only the most committed fans—and the most high-profile matchups—remain. Density of POIs around the venue plays into this as well, as the high number of restaurants and entertainment venues within steps of the DC arena.
Philadelphia was close behind, with casual dining up 31% and QSR visits rising 19%. The city hosted first- and second-round games and showed that even early-round tournament play can generate meaningful commercial lift in a large, dense market.
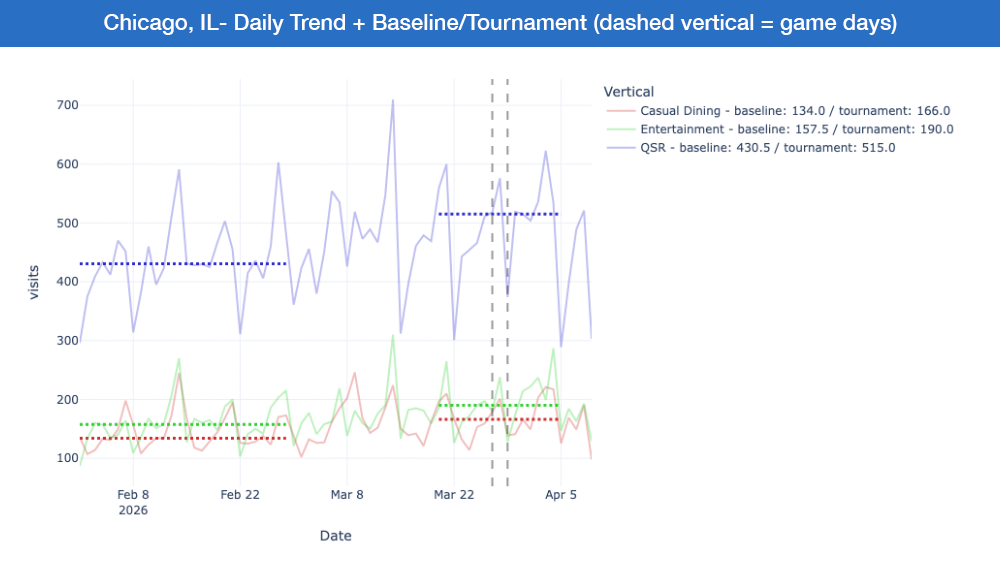
Chicago delivered the biggest absolute volume increases of any city in the dataset, with QSR visits rising from a baseline of 430.5 to 515 during tournament play—a 20% jump. Casual dining climbed 24% and entertainment 21%. Chicago hosted Sweet Sixteen games at the United Center, and the data reflects the city’s ability to absorb and amplify a large influx of visiting fans.
Oklahoma City and Houston both showed strong across-the-board gains. Oklahoma City saw QSR visits rise 15%, casual dining up 12%, and entertainment up 6%. Houston posted a 13% gain in both casual dining and entertainment, driven by first- and second-round games in a market well-equipped for large-scale event hospitality.
Indianapolis and St. Louis showed QSR as the clear winner. In Indianapolis, fast food and quick service visits rose 14% while casual dining and entertainment actually dipped slightly—a signal that fans in a repeat tournament host city may be optimizing for convenience over sit-down experiences. St. Louis saw QSR up 9% and entertainment up 24%, with casual dining rising a modest 7%.
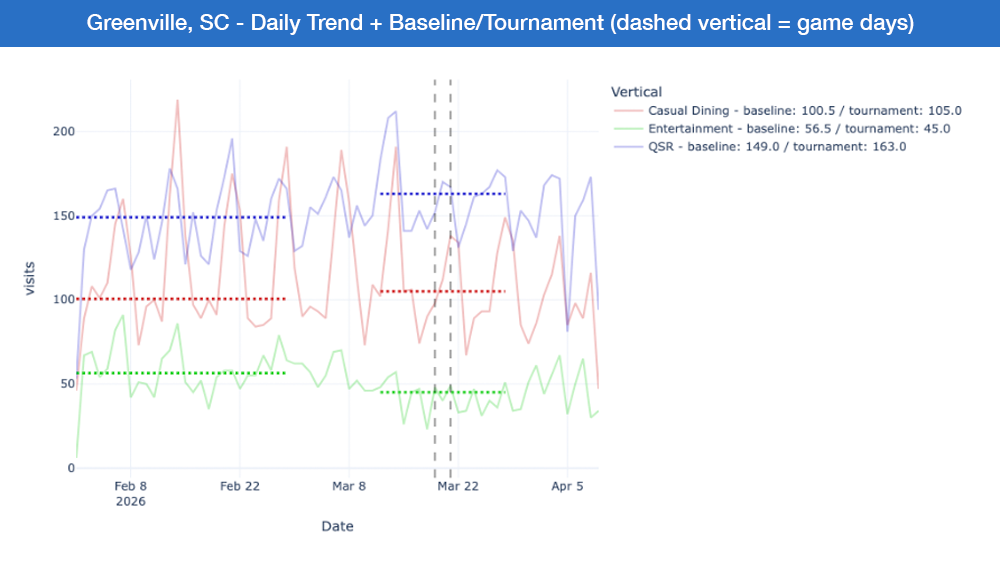
Greenville showed an interesting split: QSR up 9% and casual dining up 4%, but entertainment visits declined 20%. This could reflect the character of the Greenville market—a smaller, less entertainment-dense host city where fans gravitate toward food rather than nightlife.
San Diego and San Jose were effectively flat across all three verticals—meaningful in itself. These are affluent West Coast markets where local baseline foot traffic is already high, and the tournament’s incremental effect may be absorbed more broadly across a dispersed hospitality landscape rather than concentrated near the arena.
Buffalo and Dayton—two smaller markets that have become reliable early-round tournament destinations—showed more modest movement, consistent with shorter fan stays and lower out-of-market visitor volumes typical of first- and second-round sites.
What This Data Means for Brands
The gap between a Washington (+30% across the board) and a San Diego (flat) is not random. It reflects the combination of round significance, city size, fan travel patterns, and local hospitality density. For a QSR brand with locations near tournament venues, this data has direct implications for staffing, local media spend, and promotional timing. For a casual dining chain, it points to which host cities may warrant incremental marketing investment and which may not.
More broadly, the data confirms something that many sports marketers already suspect but struggle to prove: the tournament doesn’t just fill arenas—it fills restaurants, bars, and entertainment districts. And the brands best positioned to capture that spend are the ones with IRL measurement infrastructure in place that can attribute visits directly to their media and marketing.
Tuesdays at Wendy’s: A National Promo Driving Local Foot Traffic
For the bulk of this study, we measured verified visits to local POIs across select verticals by anonymized, opted-in devices within hosted-game windows. And for an interesting insight into the effect a specific national promotion focused on a major sporting event can have on store traffic, we look to Wendy’s.
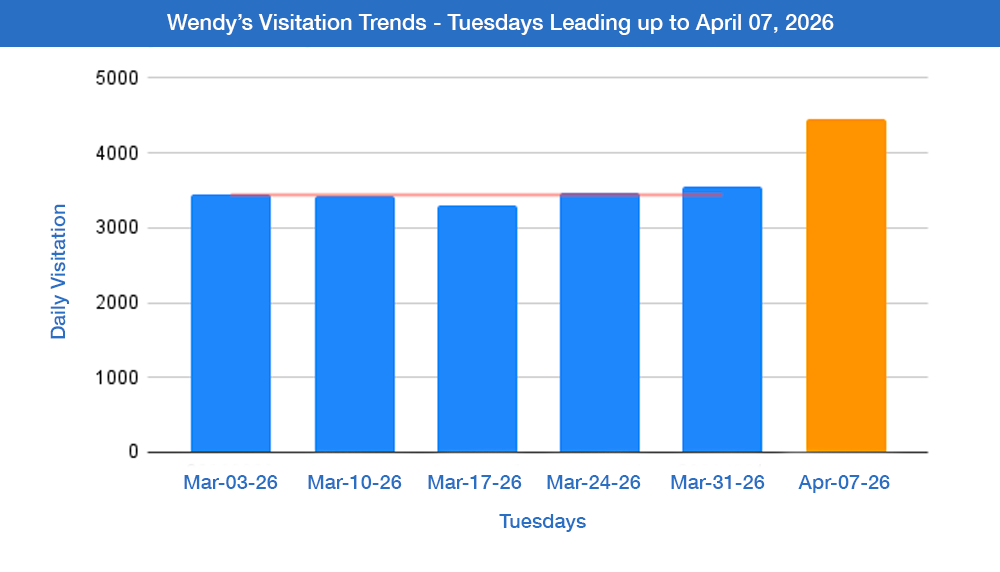
The offer? Free french fries and a Frosty, available in-restaurant only, on Tuesday, April 7 at U.S. Wendy’s locations. Using raw visit numbers (not normalized for panel size, etc.), we measured a 30% increase on April 7 at Wendy’s over the baseline established by the previous five Tuesdays at Wendy’s. This demonstrates the value of leveraging a large national sporting event with a truly focused national promotion, with a specific IRL action directed at your POI.
From Foot Traffic to the Full Picture: Visits + Transactions
Measuring foot traffic lift during a major sporting event is valuable to marketers, but knowing how many of those visits turned into sales—and the amount of revenue attributable to a campaign—creates a holistic attribution picture that proves ROI across a spectrum from engagement through transaction.
That’s exactly what Cuebiq’s partnership with Affinity Solutions makes possible.
Cuebiq now integrates store-level sales KPIs directly into its measurement dashboard, alongside traditional visit attribution metrics. Through Affinity’s exclusive access to fully permissioned purchase data from over 100 million cardholders—representing 96 billion+ transactions from 3,000+ banks and financial institutions—brands can now see, in a single dashboard, both the foot traffic their campaigns drove and the actual sales those visits generated.
The metrics available include Total Transactions, Unique Shoppers, Total Spend, Sales Rate, Sales Uplift, and Average Basket Size—all tied to the same exposed user base as Cuebiq’s footfall analytics. A QSR brand running a campaign across CTV, social, and OOH can now answer several valuable questions:
- Did our ads drive people to our locations? If so, how many? And at what rate compared to people who didn’t see the ads?
- Did those people buy something? How much did they spend compared to people who didn’t see our ads?”
All of this is built on the same privacy-first foundation that underpins everything Cuebiq does. Affinity’s transaction data is fully anonymized and consented; Cuebiq’s location data is 100% opt-in. The matching methodology between the two datasets preserves individual privacy at every step while still delivering statistically robust, actionable measurement at the campaign level.
Privacy-Safe Intelligence You Can Trust
Every insight in this analysis—and every measurement solution Cuebiq offers—starts with the same non-negotiable principle: no individual is ever identified. Cuebiq’s four pillars of Consent, Transparency, Control, and Accountability govern how data is collected, processed, and delivered to clients. We partner with 100+ apps to gather first-party location signals from users who have explicitly agreed to share their data. All signals are de-identified in real time, and our practices are NAI-certified, TrustArc-certified, TAG-certified, and fully compliant with GDPR and CCPA.
So not only can you count on Cuebiq to deliver measurement, attribution, and insights to prove campaign impact and fuel future strategies, you can rest assured knowing that all the data is high quality and always built to respect the privacy of your customers.
If you haven’t already, check out our first Sports Tourism piece on baseball spring training 2026. Next in the series, we’ll deliver weekly insights on fan travel as well as POI visits throughout the World Cup! Stay tuned…
Contact Cuebiq today for more information or to schedule a demo. Let’s do something amazing together!


