

What spring training baseball location data reveals about fandom—and what it could mean for marketers.
This report on baseball location data is the first installment of our Sports Tourism series, in which we use anonymized, privacy-safe location intelligence to explore how major sporting events move people—literally. In the coming weeks we’ll analyze foot traffic and economic impact around March Madness host cities, then measure fan movement in and around World Cup venues. But we start where the baseball season starts: Spring Training.
Spring Training is a rite of passage for baseball fans. Every February, as the rest of the country braces against winter, tens of thousands of devoted fans pack their bags and make their way to Florida’s Grapefruit League and Arizona’s Cactus League to see their teams prep for Opening Day. It’s informal and up close in a way the regular season can’t be.
It also generates a remarkable amount of IRL data and customer insights.
The Numbers Behind the Pilgrimage – Baseball Location Data Tells a Story
Spring Training is booming post-pandemic. The Cactus League drew 1,753,849 fans across 237 games in 2026—a 3.4 percent increase over 2025 and the largest single-season attendance total since 2018. That enthusiasm extends well beyond the ballpark: nationally televised MLB broadcasts are averaging 2.28 million viewers in 2026, a 44 percent jump over last season and the sport’s best national viewership figure since 2017. Netflix’s Opening Night exclusive between the Yankees and Giants pulled nearly 3 million viewers—the most-watched Opening Night since 2020. Baseball’s cultural momentum is gaining, and is reflected everywhere from the turnstiles to the streams.
Popular wisdom dictates that most of the fans making the Spring Training trip are mostly local snowbirds. But the data reveals a different take: many of them traveled a very long way.
What Cuebiq’s Baseball Location Data Reveals
To understand who actually shows up, Cuebiq analyzed anonymized, opted-in device data from fans who visited Grapefruit or Cactus League stadiums between February 20 and March 6, 2026. A device qualified by spending at least 5 minutes within the geohash boundary of a Spring Training stadium. We then identified each device’s home team—based on the state or DMA where it logged the most activity between May 2025 and January 2026—and excluded any devices already based in Florida or Arizona, as well as visitors to the Toronto Blue Jays and Arizona Diamondbacks home markets.
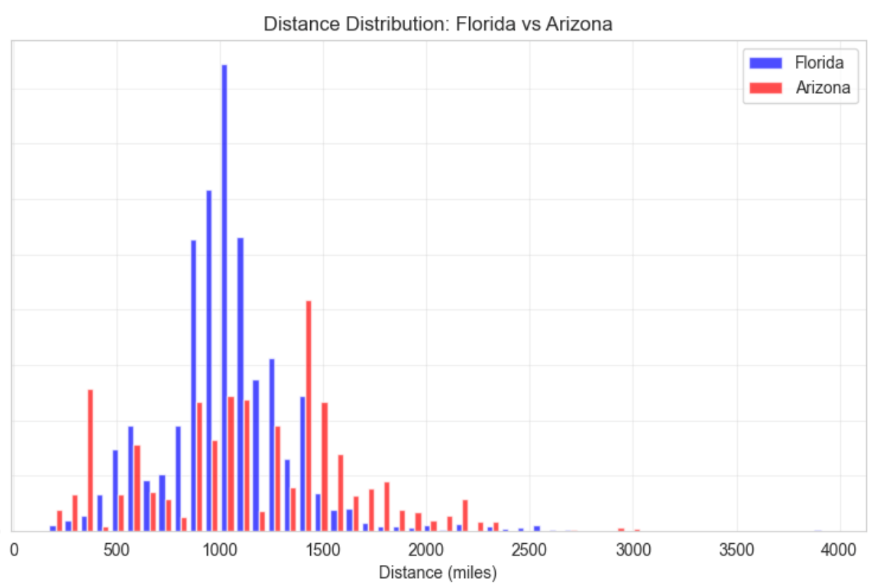
- Fans travel far—and Florida draws from closer in. The distance distribution for Florida visitors peaks around 1,000 miles, consistent with fans traveling from the upper Midwest and Mid-Atlantic. Arizona visitors show a wider spread, with their biggest concentration around 1,400–1,500 miles, reflecting West Coast fans making the trip to Cactus League territory.
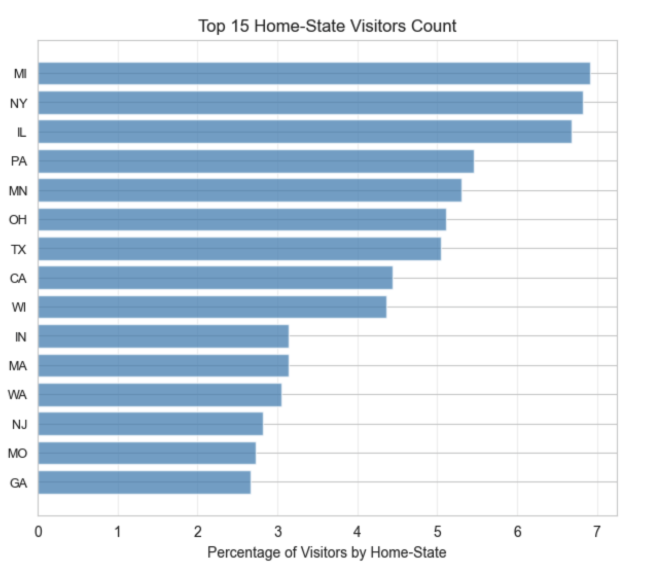
- The Midwest and Northeast drive the most visitors. At the state level, Michigan leads all home states in visitor share, followed closely by New York and Illinois. Pennsylvania, Minnesota, Ohio, Texas, California, and Wisconsin round out the top nine. When the measure shifts to total miles traveled—a proxy for willingness to travel rather than raw fan count—Illinois and New York claim the top two spots, followed by Michigan and Minnesota. In other words, those fans don’t just show up in numbers; they’re also traveling from farther away.
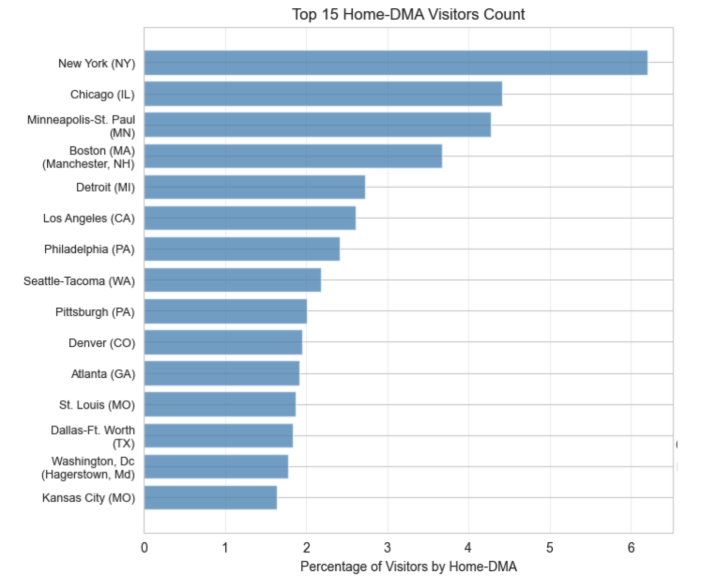
- At the DMA level, New York stands alone. Unsurprisingly, the New York DMA generates over 6% of all out-of-market Spring Training visitors, making it the single largest origin market by a meaningful margin. Intuitively, NYC’s greater volume population, two franchises in the market, and the popularity of Florida as a winter destination across the five boroughs all contribute to this result.
- Chicago and Minneapolis-St. Paul follow. When ranked by miles traveled, New York and Chicago again lead, with Minneapolis-St. Paul, Boston, and Detroit rounding out the top five. For destination marketers and media buyers, this tells a clear story about where Spring Training campaigns should be concentrated.
- Geography determines Florida vs. Arizona preference. Fans don’t choose their Spring Training destination at random—where they reside strongly predicts where they visit. East Coast DMAs, led by Pittsburgh, Baltimore, Hartford & New Haven, Harrisburg, Rochester, and Philadelphia, show strong preference for Florida. West Coast and Mountain West DMAs—San Diego, Portland, Boise, San Francisco, Los Angeles, Albuquerque, and Seattle—lean heavily toward Arizona. New York, Boston, and Detroit land closer to the middle but still tilt Florida.
Loyalty in Motion: The Home-Team Effect in Baseball Location Data
The most compelling finding from our baseball location data analysis may be the clearest signal of true fan loyalty: a meaningful share of these visitors specifically traveled to watch their own team.
At the state level, 28.1% of visitors came from the same state as their Spring Training team—fans who could have gone anywhere but chose to follow their club. The Detroit Tigers, Minnesota Twins, and Chicago Cubs lead all teams in home-state visitor share. Another 38.5% chose a different team than their home-state club, suggesting that Spring Training also functions as a broader baseball experience, not purely a tribal pilgrimage. The remaining 33.4% came from states without a Spring Training team—fans who simply want to be near the game.
At the DMA level the baseball location data picture shifts meaningfully. Because DMAs are more narrowly defined than states, the “No Home Team” segment expands to 49.5%—nearly half of all visitors hail from markets without a Spring Training franchise nearby. Home Team loyalty drops to 21.4% and Other Team accounts for 29.1%. This is a critical insight: a large, addressable audience of fans is attending Spring Training without a clear home-team attachment, making them prime targets for brand and destination messaging that isn’t team-specific.
At the DMA level, the Chicago Cubs claim the top spot for home-market visitor loyalty, followed by the Minnesota Twins, Boston Red Sox, New York Yankees, Seattle Mariners, and Pittsburgh Pirates.
Stadium Draw: Popularity vs. Activity
Not all stadiums attract fans equally. Cuebiq’s data shows both unique visitor share—a measure of how broadly a stadium draws—and total visit share, which reflects repeat engagement and dwell.
In Arizona, baseball location data shows the Athletics and Chicago Cubs tie for the highest unique visitor share at 5.3% each, ahead of the Kansas City Royals, Texas Rangers (both 4.9%), and the Boston Red Sox (4.9%). In terms of total visits—which captures fans who come back more than once—the Athletics and Cubs again lead (6.8% and 6.0%), with the Royals and Rangers close behind at 6.7% each. Arizona Cactus League venues clearly drive high repeat visitation, a signal of deep fan engagement and longer stays.
In Florida, the New York Yankees (4.7%), Miami Marlins (4.2%), St. Louis Cardinals (4.2%), Detroit Tigers (4.2%), and Tampa Bay Rays (4.0%) lead in unique visitors among Grapefruit League stadiums.
Why Baseball Location Data Matters for Marketers and Rights Holders
The insight here goes well beyond interesting data. For MLB teams, sponsors, travel brands, hospitality companies, and destination marketing organizations, knowing where fans come from—not just that they showed up—unlocks a new tier of campaign precision.
A Florida tourism board now knows that Pittsburgh fans are its highest-propensity out-of-state Spring Training audience and can build paid media targeting accordingly. A hotel brand knows that fans traveling from Chicago or New York are coming from 1,000+ miles away, which speaks directly to length-of-stay decisions and travel package design. An MLB team sponsor can identify which DMAs over-index for fan loyalty versus casual interest—and price and target them differently. And any brand activating at the stadium level can now see which venues generate the most repeat visits, pointing to higher dwell time and greater exposure opportunity.
Privacy-Safe Intelligence You Can Trust
Every insight in this analysis rests on a data foundation Cuebiq has built since its founding: 100% opt-in, fully anonymized, and never linked to any individual. Our four pillars—Consent, Transparency, Control, and Accountability—aren’t compliance language. They’re the architecture of how every data point is collected and processed. Cuebiq partners with 100+ apps to gather first-party location signals exclusively from users who have explicitly agreed to share their location. All data is de-identified in real time, and our practices are certified by NAI, TrustArc, and TAG, and fully compliant with GDPR and CCPA.
The audience intelligence you activate through Cuebiq is built on a panel you can trust, defend, and scale—from reaching Detroit Tigers fans in Michigan to targeting Cubs loyalists making a long weekend out of the Cactus League.
Sports Tourism Part 2 drops soon—we’ll be looking back at March Madness 2026 host cities to examine foot traffic in local dining and entertainment venues during the tournament as a proxy for economic impact. And soon, we’ll measure fan movement to World Cup venues and traffic in local businesses as the tournament gets underway. Stay tuned…
Contact Cuebiq today for more information or to schedule a demo. Let’s do something amazing together!


