

Customer Behavior during the biggest annual retail event: What We Saw on Black Friday 2023-2025
TL;DR Black Friday Isn’t Fading. It’s Changing Shape. Shoppers still show up. How many, and where, shifts every year.
Every November, the questions gets whispered in hot takes across Linkedin and the blogosphere: Does Black Friday still matter? Is it over?
The acceleration of CyberMonday and e-comm sales can offer context and induce pearl-clutching, but the real story and validation of Black Friday is in how customers vote with their feet.
Cuebiq analyzed verified, privacy-first foot traffic across seven retail verticals for Black Friday 2023, 2024, and 2025. Each day’s visits are indexed against a pre-holiday baseline (created by looking at the traffic from eight to two weeks before that year’s Black Friday). For the data you see below, Lift = Black Friday visits vs. the pre-holiday baseline. Every number in this analysis is true lift, not seasonal noise.
One rule holds in every vertical, every year (direct from the Obvious Department): Thanksgiving itself is the quietest day of the season. Visits fall 41–98% below baseline as most stores close. Then comes the snap-back, and the size of that snap-back is where the story lives.
Clothing and Accessories: Still the Black Friday Doorbuster
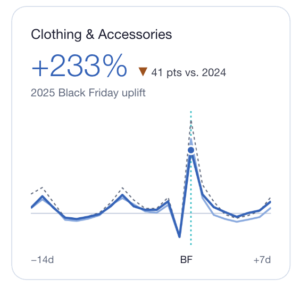
Apparel posted the biggest Black Friday lift all three years: +346% in 2023, +274% in 2024, and +233% in 2025. And while the spike is narrowing, the Saturday after still ran 57–106% above baseline. Apparel shoppers make a weekend of it.
Sporting Goods: The Black Friday Comeback
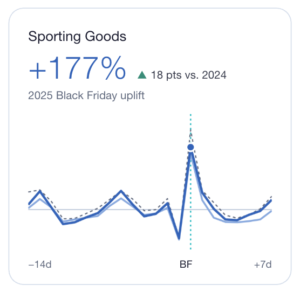
Sporting goods surged +227% in 2023, cooled to +159% in 2024, then climbed back to +177% in 2025.
The Saturday after followed the same arc: +54% in 2023, +27% in 2024, +48% in 2025. Sporting goods doesn’t just win Friday. It holds the weekend.
Consumer Electronics: Fully Recovered
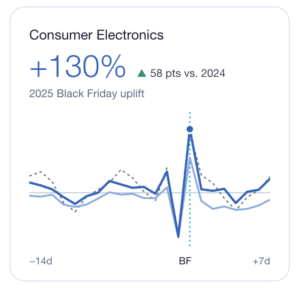
Electronics fell from +125% in 2023 to +72% in 2024. Then it hit a three-year high of +130% in 2025. No vertical rebounded harder.
The weekend shows the difference. In 2024, Saturday visits fell 17% below baseline; shoppers came for Friday deals and left. In 2025, Saturday held above baseline (+7%).
Home Improvement and Repair: Steady Black Friday Demand
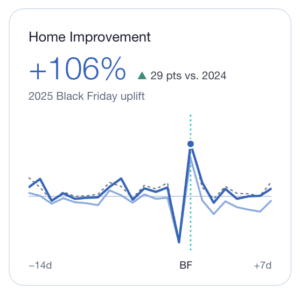
Home improvement lifted +113%, +77%, and +106%. Same arc as the broader market: a soft 2024, a strong 2025.
The 2025 Saturday after Black Friday (+28%) was the strongest of the three years. Home improvement drew a second wave of trips.
Big Box: Black Friday Starts Wednesday
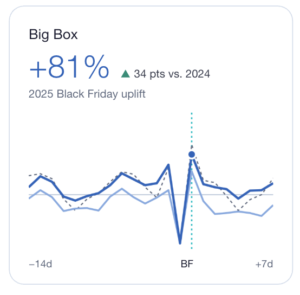
Big box stores lifted +101%, +47%, and +81% on Black Friday. The day before Thanksgiving matters too: visits ran 60% above baseline in 2025, vs. just 9% in 2024.
The tail moved too. In 2024, traffic dropped off fast: Sunday visits ran 39% below baseline. In 2025, Sunday stayed 15% above.
Grocery Stores and Supermarkets: Peaks Before the Holiday
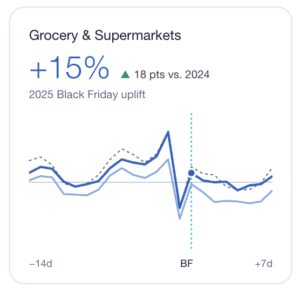
This data point comes from the law offices of Obvious, Obvious, and Obvious: Grocery is the outlier. Its peak is the Wednesday before Thanksgiving (+83%, +37%, +81%), not Black Friday. Bonus points if you can figure out why.
The run-up starts Tuesday (+46%, +17%, +42%). For grocery marketers, the window that matters closes before Black Friday begins.
Retail Overall: The Bellwether
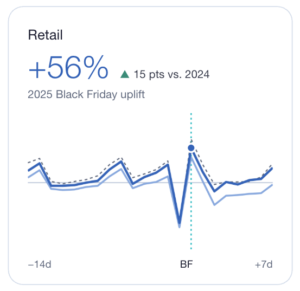
The total retail category rose +70% in 2023, +41% in 2024, and +56% in 2025.
The pattern: 2024 was the soft year in every vertical. A compressed calendar may have played a role; Thanksgiving fell on Nov. 28, the latest possible date. 2025 brought a broad rebound.
What it means for marketers: the Black Friday window is longer than one day, and it moves. Plan media and measurement around a single date, and you miss the Wednesday run-up and the weekend tail. The good news? It’s not too late to put measurement in place for 2026. Contact us to do a fast feasibility check.
Net Net: The Black Friday Surge Hits All Coasts. Your Media Has to Earn Its Share.
Black Friday lifts traffic for (almost) every category. Which means your competitors will see a surge whether they advertise or not. So the real question isn’t how many people walked in. It’s how many walked in because of your campaign.
That’s incrementality, and it’s what Cuebiq footfall attribution measures: store visits from people exposed to your ads, compared against a control group that wasn’t. In our 2025 Benchmark Report, the top quarter of consumer electronics campaigns cleared 21.43% uplift, at about $0.13 per incremental visit. Top home improvement campaigns cleared 23.6%.
Download the 2025 Benchmark Report to see how campaigns in your vertical performed on uplift, visit rate, incrementality effect, and cost per incremental visit.
Black Friday 2026: Cuebiq Findings Drop Monday, Nov. 30
Black Friday 2026 lands on Nov. 27. The questions write themselves. The answers will come as the dust settles on CyberMonday. Will apparel’s lift keep narrowing? Can electronics hold its 2025 high? Will shoppers start on Wednesday again? Will economic headwinds suppress the lift? Will grocery stores come out of nowhere and go crazy on Black Friday (hint: the answer to this one is already in the books)?
We’ll publish our 2026 findings the Monday after Black Friday. Days after the doors open and the crowds peak, not weeks.
That speed is the point. Digital engagement is important, but doesn’t bridge the attribution gap. Surveys capture intent, but not IRL behavior. Cuebiq measures where people actually go, built on four privacy pillars: Consent, Transparency, Control, and Accountability. Our data is certified by NAI, TrustArc, and TAG, and compliant with GDPR and CCPA.
Want to Measure Your Media’s Black Friday Performance? You’re in the Right Place…
To know how your brand, your competitors, or your category performs this Black Friday? Book a demo and see verified foot traffic in action. We can check feasibility quickly, so it’s not too late to get in under the wire and measure your Black Friday traffic with our verified, privacy-first footfall data—or to see performance across your entire holiday season.


