Cuebiq’s Study of Black Friday Foot Traffic—and What the Data Means for Retailers
Black Friday looked different this year.
While retail foot traffic did not reach the same surge we saw in 2024, consumer spending grew. Unsurprisingly, the lion’s share of spend came from record-breaking online shopping. This shift has been happening for decades, but continues to raise important questions about consumer behavior, local trends, and how brands should adjust their strategies.
Cuebiq wanted to go deeper on the numbers to provide better measurement and more clarity, so we ran a national study to see how, where, and when people moved in and out of stores on the most talked-about retail day of the year.
This piece is just a sampling of the data and insights we were able to gather in this year’s study. For more in-depth access to our findings and analysis, get in touch with the Cuebiq team.
A Quick Overview of the Cuebiq Black Friday Study
Cuebiq analyzed more than 1.1 million unique devices across every statistically significant corner of the United States to understand in-store Black Friday activity in both 2024 and 2025.
To make our year-over-year comparisons accurate and bake in the proper context for each set of data, we established a baseline of foot traffic for each year by using the seven weeks leading up to Black Friday. The baselines for each year are built from four weeks of normal foot traffic with two weeks of cool-off time.
- 2024 baseline: October 14 – November 10
- 2025 baseline: October 13 – November 9
This approach keeps our measurement rooted in the consumer and marketplace realities of each specific year. It reflects seasonality, consumer confidence and sentiment, and promotional cycles without being influenced by data from unrelated or disconnected periods of time.
Across nearly all verticals and geographies, Black Friday foot traffic rose above the baseline in both years. But a spike in retail foot traffic on Black Friday is not uncommon. What is interesting is that the spike in 2025 was muted in comparison to the previous year, and this bears consideration by the brands, agencies, and channels driving retail traffic.
Black Friday 2025 showed a clear slowdown in retail foot traffic. The average increase over baseline in 2025 was 59.5%, down from 74% in 2024.
Meanwhile, unsurprisingly, online spending surged:
- CBS News reported $11.8B in Black Friday online sales, a 9.1% jump from 2024
- Consumers got a digital jump on Black Friday, with a record-breaking $6.4B in online sales on Thanksgiving Day
- Between 10 a.m. and 2 p.m. on Black Friday, consumers spent $12.5M per minute online
- MasterCard SpendingPulse reported online sales grew 10.4% YoY, while in-store spend rose only 1.7%
These sales numbers provide important context for the foot-traffic results of Cuebiq’s Black Friday study. Let’s look at some of the numbers…
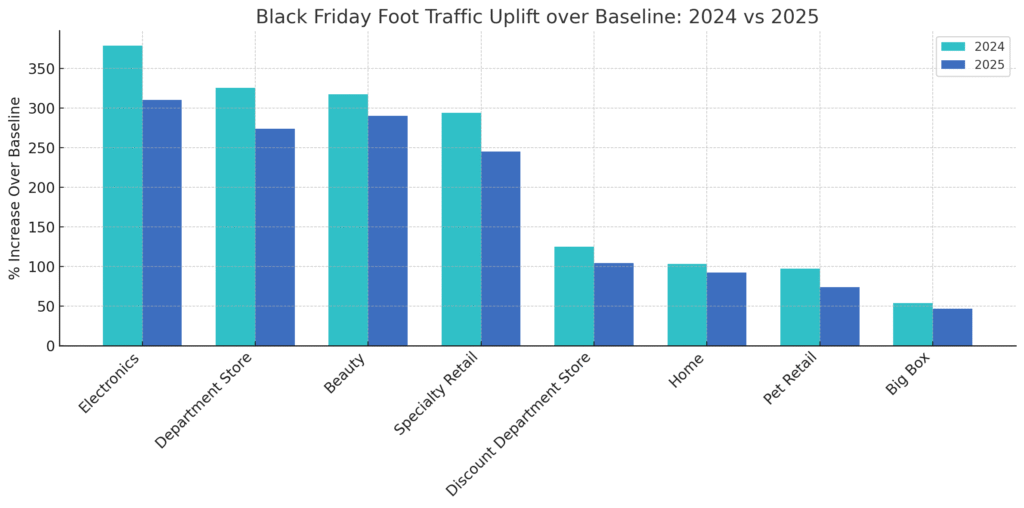
Performance by Vertical:
Electronics Still Lead, But Growth Slowed Overall
Some retail verticals continued to deliver strong Black Friday lifts in foot traffic:
- Electronics: 310% increase in foot traffic over baseline in 2025 (down from a 379% lift in 2024)
- Department Stores: 273% increase in 2025 foot traffic (down from 326% increase in 2024)
- Home Stores: 92% increase in 2025 (down from 103% in 2024)
- Pet Stores: 74% increase in 2025 (down from 97% in 2024)
State-Level Trends:
Some Sharp Drops, Some Steady Performers
Across most states in the study, the decline in foot traffic is evident:
- Ohio: 105% uplift over baseline in 2024 decreased to 65% uplift in 2025
- Montana: Showed the lowest increase over baseline in 2025 at ~22%
- Iowa: Enjoyed the highest uplift over baseline in 2025 at ~105%
- South Dakota: One of the few states with an increase (74% increase over baseline in 2025 vs. 65% increase over baseline in 2024)
In addition, some states stayed relatively stable YoY, including South Carolina, Virginia, Massachusetts, and North Dakota.
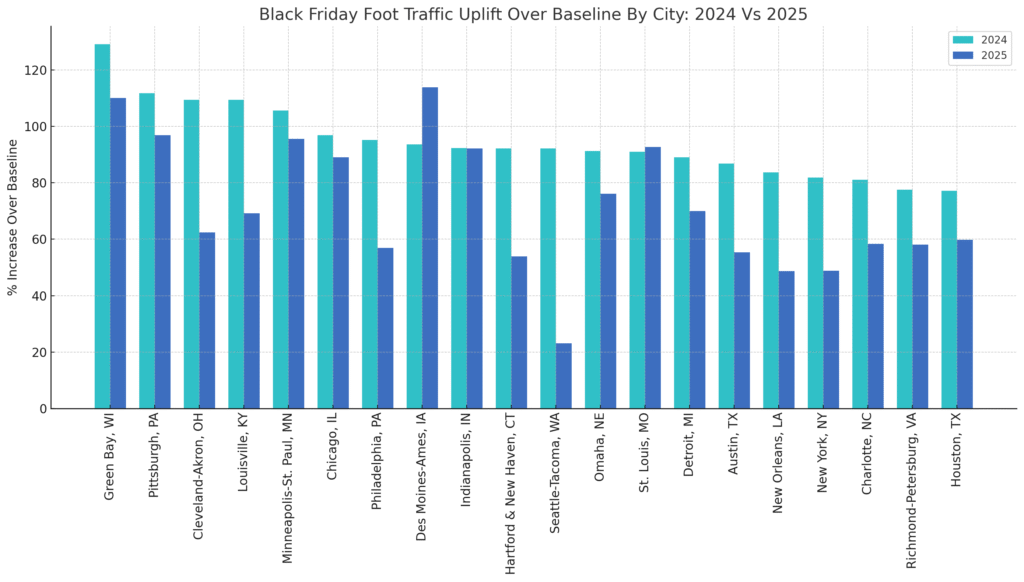
City-Level Trends:
Huge Swings Between Markets
Foot-traffic increases over baseline varied widely across major metro areas:
- Seattle: 23% uplift over baseline in 2025 (down from 92% in 2024)
- New York: 49% uplift in 2025 (down from 82% in 2024)
- Green Bay: 110% uplift in 2025 (down from 130%)
- Cedar Rapids: Largest uplift over baseline in 2025 at 115% in 2025 (~99% in 2024)
In addition to Cedar Rapids, a few other cities (including Miami, Memphis, and St. Louis) saw increases over their prior-year uplift.
What Does This Mean for Brands?
Despite economic headwinds and waning consumer sentiment, people are still shopping and spending as the 2025 holiday season kicks into high gear. However, and this should come as no surprise, consumers continue to change HOW they shop and spend.
In addition to choosing different channels, different timing, and different stores than prior years, AI is making an impact: AI-driven traffic to online retail pages soared 805% compared to 2024.
At first glance, the data and reported spend seem to provide more nails for the coffin of IRL retail. But don’t pronounce time-of-death just yet. In fact, many counterintuitive insights come to light when you view this study through a macro-understanding of the realities of retail cycles and trends.
While more transactions than ever occur online, in-store signals and location data continue to increase in importance for the overall health of retail brands. As more and more of our daily tasks, transactions, and responsibilities are tended to on screens, the places consumers choose to go and spend time grows in importance and meaning.
As a result, measuring actual footfalls and location data empowers brands—and their agencies—to understand how customers move across and between online and offline environments, how demand shifts across regions, and how to plan investments in location, inventory, staffing, and marketing with more precision.
Cuebiq partners with agencies, platforms, and brands to more deeply understand human behavior—and optimize campaigns by measuring their impact and ability to spark real-world visits. This allows marketers to build strategies, audiences, and campaigns informed by actual customer behavior—with customer privacy at the center of it all.
Better data leads to better questions. Better questions lead to stronger decisions. Stronger decisions lead to better performance.
To learn why Cuebiq is the trusted catalyst to spark sustained growth and returns on campaigns by measuring human behavior, contact us today or book a demo.